Geospatial Mapping Techniques Enhancing Pre-Race Strategies in Global Horse Racing Syndicates

Professional horse racing syndicates have integrated geospatial mapping techniques into their pre-race assessment protocols at an accelerating pace since the mid-2020s, and data from industry reports indicate these tools now influence decisions across major racing jurisdictions. Geospatial systems combine geographic information systems with high-resolution terrain data, GPS tracking layers, and historical performance records to generate detailed models of racecourse conditions. Syndicates operating in Australia, the United States, France, and Japan apply these models to evaluate track surfaces, drainage patterns, and elevation changes before each meeting, which allows them to adjust selection criteria for individual runners.
Core Components of Geospatial Mapping in Racing Contexts
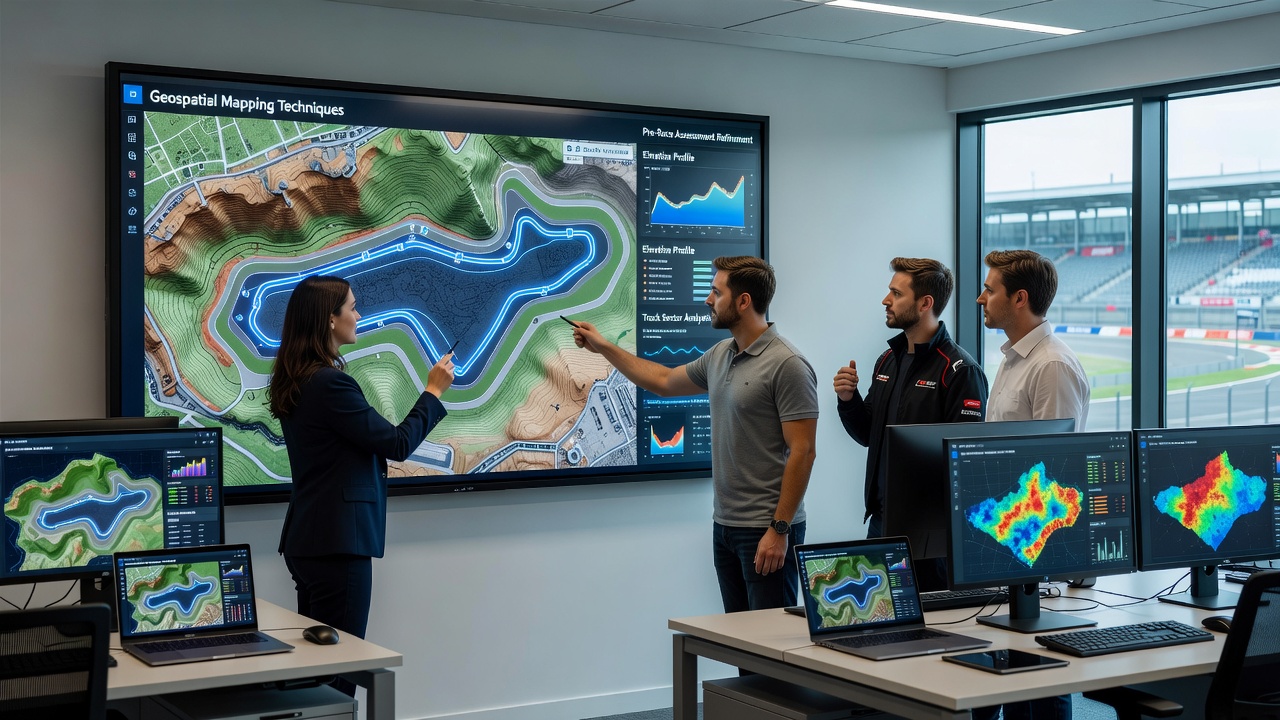
Modern geospatial platforms used by syndicates incorporate LiDAR scans, satellite-derived elevation models, and ground-penetrating radar to map subsurface moisture levels and soil compaction across entire circuits. These datasets merge with real-time sensor feeds from weather stations positioned along straights and bends, creating dynamic visualizations that update hourly during race weeks. Observers note that syndicates in the Melbourne metropolitan area began routine adoption of such combined layers in early 2025, and similar programs expanded to tracks in Kentucky and Chantilly by the first quarter of 2026. The resulting maps highlight micro-variations in camber and banking that affect stride length and energy expenditure for different horse conformations.
Researchers at several equine science centers have documented how syndicates overlay past race times and sectional data onto these geospatial grids, revealing correlations between specific track segments and finishing positions under varying firmness ratings. In July 2026, updated mapping protocols at several Group 1 venues incorporated additional drone-derived orthomosaic imagery, which refined the resolution of surface wear patterns that develop between meetings.
Application Across International Racing Operations
Syndicates based in the southern hemisphere have led integration efforts because many of their primary tracks feature pronounced elevation shifts and seasonal ground movement. Teams review geospatial heat maps that flag areas prone to water accumulation after heavy rainfall, then cross-reference those zones with historical results from horses known to perform better on firmer or softer going. Northern hemisphere operations have followed the same workflow, particularly at venues where irrigation systems create uneven moisture distribution across the racing surface.
One documented workflow involves loading a racecard into a geospatial dashboard, applying filters for distance, class, and recent form, then querying the underlying terrain database for relevant sections of the track. Analysts generate probability-weighted outputs that adjust baseline speed figures according to measured gradients and surface variability. Figures released by racing authorities in Australia and the European Union show that syndicates employing these methods recorded measurable shifts in their strike rates during the 2025-2026 season compared with earlier periods that relied primarily on manual track walks and static going reports.
Data Integration and Syndicate Decision Workflows
Geospatial outputs feed directly into syndicate risk models that combine track geometry with horse-specific biomechanical profiles. GPS collars fitted during training sessions record stride frequency and length over mapped sections of gallops, allowing syndicates to predict how an individual animal will respond to the precise camber and surface conditions scheduled for an upcoming race. These predictions update automatically when new LiDAR surveys detect changes caused by maintenance work or weather events.
Industry organizations such as the Racing Australia technical committee and the Hong Kong Jockey Club research division have published summaries showing increased use of these integrated datasets among licensed syndicates. The reports highlight that mapping layers now include subsurface drainage infrastructure diagrams, which help teams anticipate how quickly particular sections will recover after irrigation or rainfall. Syndicates in North America have begun testing similar overlays at tracks participating in the Breeders' Cup circuit, with initial deployments noted during the spring 2026 preparation period.
Current Developments Observed in Mid-2026
By July 2026, several syndicates reported routine incorporation of machine-learning algorithms that process geospatial layers alongside veterinary and performance records. These algorithms identify patterns such as consistent underperformance on tracks with pronounced downhill gradients or specific turn radii. Training facilities in both hemispheres now maintain permanent geospatial baselines that update after every major surface renovation, giving syndicates access to longitudinal datasets spanning multiple seasons.
Regulatory bodies in multiple jurisdictions have begun requesting access to the same mapping resources when reviewing racecourse safety standards. The alignment between syndicate assessment tools and official track maintenance records has reduced discrepancies between published going descriptions and actual measured conditions at several venues. Those alignments continue to expand as more syndicates contribute anonymized geospatial datasets to shared industry repositories.
Conclusion
Geospatial mapping techniques have moved from experimental pilots to standard components of pre-race preparation within professional horse racing syndicates operating worldwide. The combination of high-resolution terrain data, historical performance overlays, and real-time sensor inputs supplies syndicates with granular assessments of track variables that influence horse selection and race strategy. Continued refinement of these systems through 2026 indicates sustained investment across major racing centers, supported by documented improvements in data resolution and integration workflows.